
Exploring the value and economics of solar-plus-storage in commercial buildings in California, New York and Hawaii reveals that solar and storage are strongly synergistic in all three markets.
The net present values of solar-plus-storage investments are greater than the sum of the NPVs of solar investments and storage investments alone (which we looked at in an earlier post) because:
- The combination allows for much larger demand-charge reductions than either technology can achieve on its own
- Pairing storage with solar allows the owner of the storage system to claim the federal Investment Tax Credit on the storage system, subject to certain constraints on how the battery is charged
Building load profiles
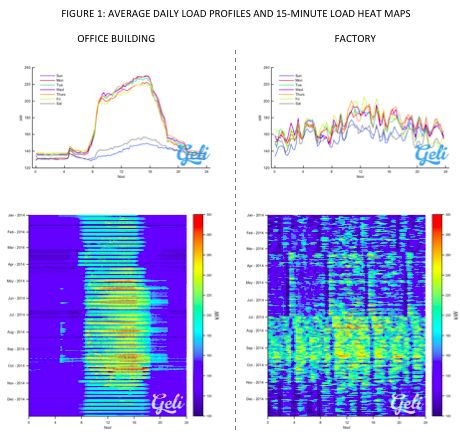
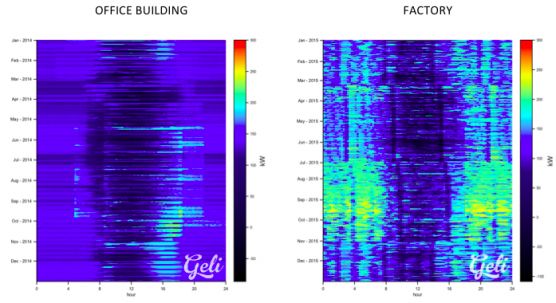
Figure 1 shows the daily average load profile and 15-minute load heat map for each of the two buildings we analyzed. The first building is an office building and the second is a factory. In both the load profiles and heat maps, time of day is on the horizontal axis, so we see the normal workday roughly in the middle. “Hotter” colors on the heat maps indicate higher temperatures.
For analytical consistency, we assume that each of these two buildings exists in each of the three locations we examined. The office building requires a much higher load during normal working hours than at other times, while the factory’s load is spread out more evenly over the entire 24-hour day, but has higher variability.
Figure 1: Average Daily Load Profiles and 15-Minute Load Heat Maps
We made several assumptions for this analysis. Figure 2 shows those that are not building- or location-specific.
Figure 2: Solar-Plus-Storage Global Model Assumptions
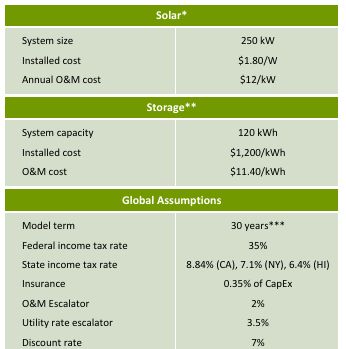
*Assumes inverter replacement in the 10th year
**No assumption made on system load rating, as it is variable with the optimal operation in each state
***Assumes energy storage system replacement in the 15th year
Source: Woodlawn Associates
Energy storage and ITC eligibility
With certain caveats, energy storage paired with solar is eligible for the federal Investment Tax Credit (ITC), according to IRS Private Letter Ruling 121432-12. First, the systems have to be installed at the same time. Second, at least 75 percent of the electricity used to charge must come from the solar system. Finally, the ITC is reduced in proportion to the amount of energy used to charge it that does not come from the solar system.
For example, the owner of a $100,000 storage system that gets 20 percent of the energy used to charge it from the grid would be able to claim an ITC of $24,000 ($100,000 * 30% ITC * 80% of energy from solar).
California
With excellent solar resources, high electricity prices (for both demand and energy), and incentives available under the Self-Generation Incentive Program (SGIP), California should be among the best locations for both solar and storage.
The SGIP provides incentives of $1.46 per watt for storage systems, up to 60 percent of the project cost. If the system supplier is California-based, the system receives a 20 percent bonus incentive. (We assume in our analysis that the supplier is California-based.)
We assume our buildings use PG&E tariff E-19 (Medium General Demand Time-of-Use Service) and are located in San Jose.
Solar only
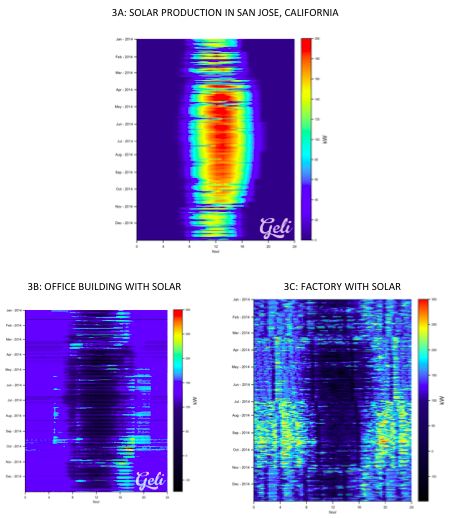
Figure 3A shows the electrical production of the solar system (generated using data from PVWatts). Figures 3B and 3C show the post-solar load heat maps for each building, in which we can clearly see that the net load is significantly lower during the day (note the lack of red in the heat maps during the day). The grid savings for the office building and factory amount to 22 percent and 21 percent, respectively, relative to the status quo in the first year of operation.
The savings come exclusively from reductions in energy charges (not demand charges). Note that both buildings still have demand over 250 kilowatts at certain times (orange or red in the heat maps).
Figures 3A, 3B and 3C: Solar PV Production and Net Building Load With Solar
Storage only
Figure 4 shows how storage would operate without solar. It would discharge throughout the peak hours and charge overnight. The grid expenses savings would be 6 percent and 10 percent in the first year for the office and factory, respectively.
Figure 4: Schematic Operation of Storage
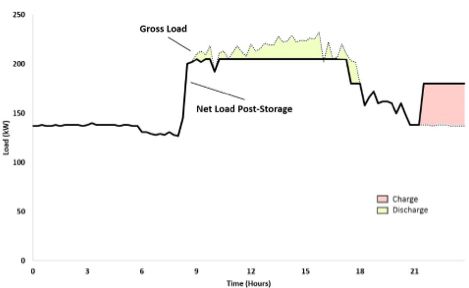
Source: Geli, Woodlawn Associates
Solar-plus-storage
Figure 5 shows the impact of installing paired storage and storage on these buildings. Neither building’s load ever goes above 250 kilowatts (note the lack of red and orange in the heat maps), which neither solar nor storage achieve on their own. The grid savings are 38 percent for the office building and 37 percent for the factory in the first year -- more than simply the addition of the savings from the two solutions separately.
Figure 5: Net Building Load With Solar-Plus-Storage
Solar-plus-storage: More than the sum of parts
In both our office building and factory cases, paired solar and storage more effectively reduce demand than either solar or storage alone. How is this possible? Figures 6A through 6D explain.
Figures 6A, 6B, 6C and 6D: Demand Reductions Due to Solar, Storage, and Storage-Plus-Solar
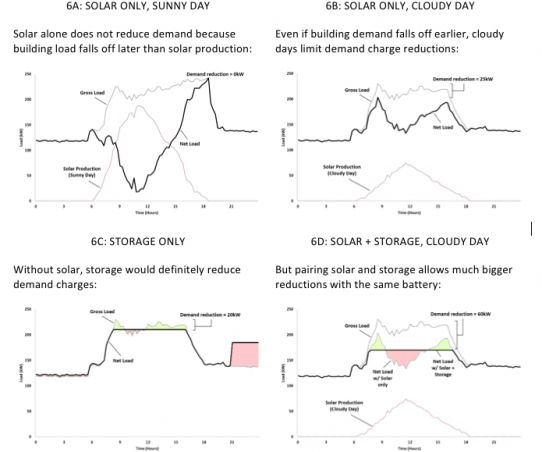
Source: Woodlawn Associates
NPV and IRR
So far we have only looked at the savings on an electric bill, but both the solar system and the storage system have costs and other benefits. Both obviously cost money to install and maintain. Both also benefit from accelerated depreciation that reduces taxable income. The solar system is eligible for the ITC, and for both buildings, the energy storage system is eligible for at least some of the ITC.
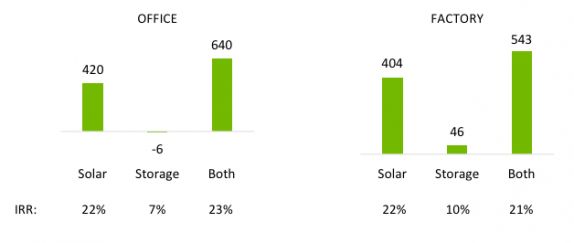
Figure 7: NPV and IRR for Solar Only, Storage Only, and Solar-Plus-Storage in California ($ Thousands)
California solar-plus-storage conclusions
In both buildings we examined, solar and storage are strongly synergistic, with combined NPVs that are significantly higher than the sum of the individual NPVs for solar and storage alone.
New York
New York is an established solar state thanks to its high cost of electricity and state rebates. Our hypothetical solar system will receive a NYSERDA incentive of $0.80 per watt for the first 50 kilowatts and $0.50 per watt on the next 150 kilowatts.
New York City, otherwise known as Con Ed Zone J, is also a hotbed of energy storage activity due to NYSERDA and Con Ed’s Demand Management Program (DMP) and associated incentives: $2.10 per average watt discharged from 2 p.m. to 6 p.m., June through September.
Analysis
When paired with solar, storage could receive the DMP incentives if it discharged during the required time periods. However, this may not be the economically optimal choice. Consider the decision tree in Figure 8. In all cases, the objective is to maximize NPV. In analyzing the optimal choice, we must determine whether it is better to, for example, operate the storage system in a way that is DMP-compliant but forgoes potential demand charge reductions, or to forgo the DMP incentive and maximize demand-charge reductions. The decision tree also highlights choices to be made about ITC compliance and tariffs.
Figure 8: New York Solar-Plus-Storage NPV Optimization Decision Tree
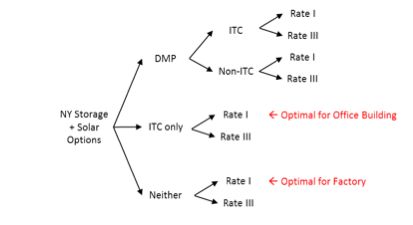
Surprisingly, we found the optimal choice for the office building was to forgo the DMP incentives, take the ITC incentives on both solar and storage, and operate on Con Ed Rate I. For the factory, we found the optimal choice was to forgo both the DMP and ITC incentives.
Another major difference between New York and California is the quality of sun. Put simply, it is cloudy more often in New York. Figure 9 shows the solar production profile for New York City.
Figure 9: Solar PV Production in New York City
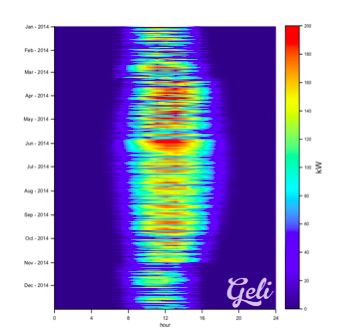
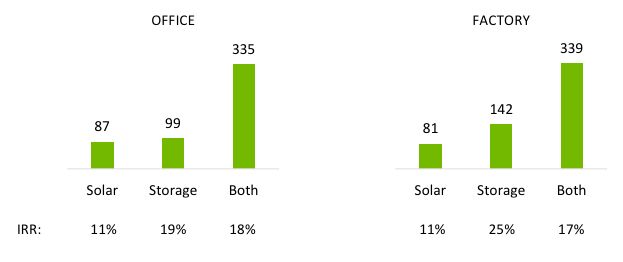
Figure 10: NPV and IRR for Solar Only, Storage Only, and Solar-Plus-Storage in New York ($ Thousands)
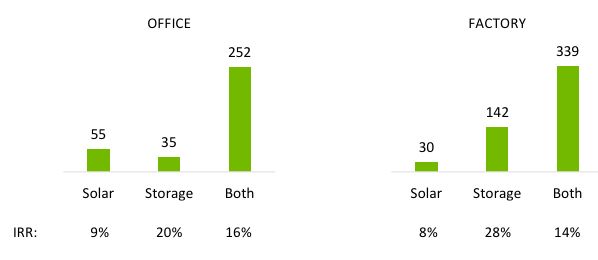
New York solar-plus-storage conclusions
Just as in California, there is a strong synergistic relationship between storage and solar. However, due to more variable solar production and different tariff structures, this phenomenon is even stronger in New York.
Hawaii
The Hawaiian Public Utilities Commission recently made a ruling that effectively ended net metering in Hawaii. For this analysis, we will look at solar without net metering, energy storage, and solar-plus-storage, assuming the buildings are in Honolulu and Schedule P is the rate used for both.
Figure 11: Solar PV Production in Honolulu
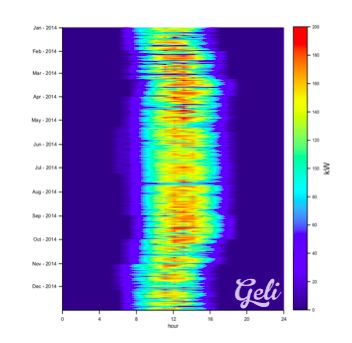
Figure 12: NPV and IRR for Solar Only, Storage Only, and Solar-Plus-Storage in Hawaii ($ Thousands)
HECO solar-plus-storage conclusions
The solar system we modeled provides very attractive returns, even without net metering, because the solar system we chose is small relative to the load. Even without net metering, we reduce our energy purchases from HECO by almost 100 percent of the generation of the solar system, allowing us to capture the full retail value of that energy.
The returns associated with energy storage alone are limited. Hawaii has no storage incentives, and HECO has lower demand charges than PG&E and Con Ed.
As in California and New York, solar-plus-storage provides the best returns. It allows larger demand-charge reductions than storage alone and allows us to benefit from the ITC.
Overall conclusions
Having undertaken this analysis without any particular point of view about the economics of solar-plus-storage, we found two things particularly interesting.
- Solar and storage are strongly synergistic. The value of paired system is greater than the value of either one of the parts on its own
- In some cases, it may make sense forgo storage incentives and/or the ITC, if the operational requirements of those incentives are such that it is not possible to optimize the demand-charge management from the customer’s perspective.
Throughout this analysis, we have assumed that the host of these systems is also the owner. We know that many developer-financiers will want to offer these systems under service agreements, as well.
Their task will be to make project investors comfortable with the idea that they can reliably predict and monetize demand-charge reductions.
***
Josh Lutton is the managing partner and Micah Sussman is a consultant at Woodlawn Associates, an energy strategy and management consultancy.
Woodlawn is grateful to Geli, a provider of intelligent energy storage software solutions, which provided the building load profiles, solar production estimates, and storage system operating profiles for the analysis. Thanks to this cooperation, we were also able to validate the economic calculations in our model versus those in an independently developed model.


 41
41
 15
15
 9
9