
One of the most important stories of the last year was the collapse in global oil prices that began in June 2014 and continues in 2015. It has created a lot of confusion among investors eyeing the impact on renewables, particularly solar PV.
Falling oil prices will have an extremely limited impact on wholesale or retail electricity prices, which are the core economic drivers for the future of solar. And yet, the situation has been terrible for publicly traded solar companies. Over the last six months, SunEdison’s stock is down almost 20 percent, SolarCity is down 30 percent, and SunPower is down almost 40 percent. This is in spite of the fact that the fundamentals of the industry continue to improve, as most analysts have made clear.
As most readers know, the short answer is that oil has nothing to do with solar. But it's helpful to look at those differences and understand why the decoupling of oil and the electricity markets is a good thing for the solar industry.
How relevant is oil to the U.S. electricity market?
If oil prices had fallen 30 years ago, when a number of American generation units were using petroleum liquids for fuel, there would have be a significant ripple effect on electricity pricing as fuel costs decreased. In 2015, the impact will be negligible, because, by and large, the U.S. does not use oil to produce electricity. Instead, we use an increasing amount of natural gas, some nuclear, and although still small, a rapidly growing amount of wind and solar.
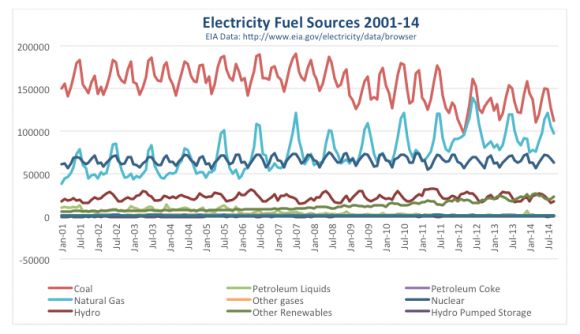
The graph below uses U.S. Energy Information Administration (EIA) data to map out electricity production by fuel source on a monthly basis from January 2001 to July 2014. Seasonal usage is apparent, with the highest-use months being July and August. The brown line represents coal, which has decreased approximately 50 percent in the last decade. The light blue line represents natural gas eating away at coal's market share. Petroleum is that light green line that effectively disappears in 2009 with a small bump in January 2014 during the polar vortex.
The steadily increasing dark green line is wind and solar, although it vastly underestimates the solar industry’s production, since EIA does not measure behind-the-meter solar systems that account for around 60 percent of installed solar capacity. (This is akin to a graph of telephone penetration in the U.S. with an asterisk on it mentioning that cell phones were not included.)
What about natural gas prices?
While falling oil prices will not directly impact the price of electricity, might they do so indirectly because of their influence on natural gas? Likely not. In fact, oil prices are likely to have a shrinking impact on natural gas prices.
Pearson’s “r” is a fairly common way to measure how two variables correlate to one another. A perfect correlation is graphed as a straight line, and is represented by a 1x. The closer to 1x, the higher the correlation.
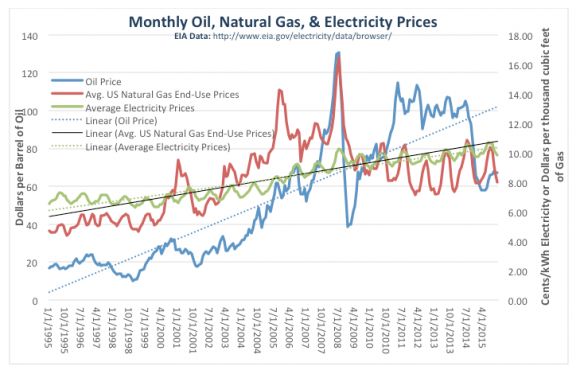
Between 1995 and 2010, monthly natural gas and oil prices tended to rise and fall in concert, as illustrated below. The r value was .84x, which is a fairly strong indication of correlation. Interestingly, for the fifteen-year period between 2000 and 2015, the r value for these two commodities dropped to .39x.
That change is likely driven by a divergence in uses. Natural gas is primarily used for heating buildings (roughly 60 percent) and producing electricity (around 31 percent), while oil is primarily used for producing gasoline (roughly 46 percent) and heating oil (roughly 20 percent).
Put another way, in 2001 the United States utilized around 17 million megawatt-hours of electricity a month from petroleum liquids. In 2014, that number was just 1,000 megawatt-hours. Natural gas increased from roughly 40 million megawatt-hours a month to approximately 65 million megawatt-hours a month in the same period. Non-hydro renewables increased from around 6 million to well over 30 million megawatt-hours per month.
The graph below represents monthly average oil, natural gas and electricity prices in the U.S. between 1995 and 2015 (the futures market). What should be clear is that while oil and natural gas were closely aligned between 1995 and 2009, the relationship between the two commodities effectively dissolved in 2009.
In sum, electricity has become more diversified across several sources, old and new, including solar and natural gas. The future will be a race among these sources to maximize efficiency and offer lower prices -- a race that solar and natural gas are winning at the moment. Oil isn’t really in the race, primarily because it is being used for fuels, not energy production.
Overall, low-cost oil is probably good for the U.S. It means a more thoughtful approach to drilling in sensitive environments, and it means Americans have a little extra change in their pocket. While solar stocks have indeed declined, and low oil prices appear (irrationally) to drive this decline, these declines could also be a natural adjustment to a segment of the stock market that has seen explosive growth.
In the meantime, the fundamentals driving the solar industry, including scale, increasingly low costs of capital, and innovation, are solid. Solar will play a central role in producing America’s electricity and driving our energy independence. This is likely why even traditional energy companies like Shell expect solar to become a massive part of the global energy mix in the coming decades.
***
Yuri Horwitz is the CEO of Sol Systems.


 41
41
 15
15
 9
9