The following is an excerpt from the newly released U.S. Solar Market Insight 2015 Year in Review report.
According to GTM Research and SEIA's U.S. Solar Market Insight 2015 Year in Review, overall PV system pricing in the United States fell by up to 17 percent over the course of 2015. The price varied by market segment, with the largest declines in the utility fixed-tilt sector.
FIGURE: Modeled U.S. National Average System Costs by Market Segment, Q4 2014-Q4 2015
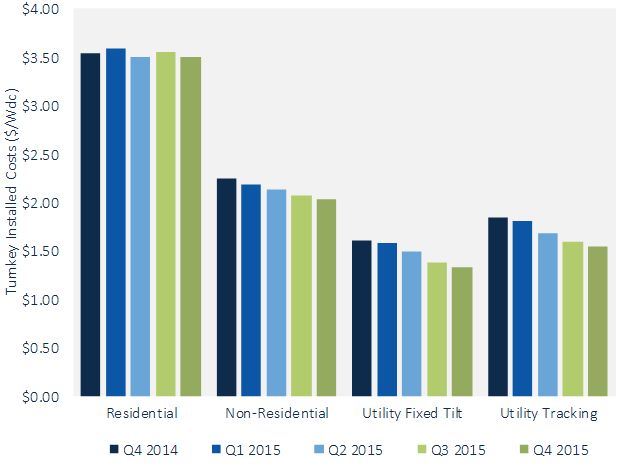
Source: GTM Research / SEIA U.S. Solar Market Insight 2015 YIR
On a quarterly basis, pricing continues to trend downward but with some leveling off in the residential sector. The was due in particular to strong investment in customer acquisition and the stubbornness of other residential soft costs. In the non-residential and utility sectors, there were annual declines of 10 percent and 17 percent, respectively. This reflects continued aggressive cost reductions (both in hardware and soft costs) in national system pricing on an aggregate basis.
Moreover, as installers and EPCs expand to regions with lower labor and regulatory compliance costs, these regions will have a larger impact on aggregate pricing. Due to advantages from scale, variations in utility system costs are much smaller than variations in residential and non-residential solar costs.
FIGURE: Modeled U.S. Average System Costs by Market Segment, Q4 2014 vs. Q4 2015
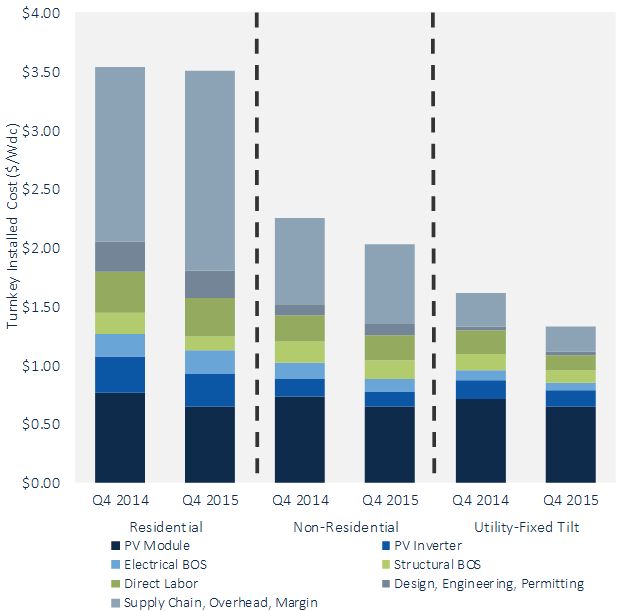
Source: GTM Research / SEIA U.S. Solar Market Insight 2015 YIR
Average pricing for residential rooftop systems landed at $3.50 per watt in the fourth quater of 2015, with nearly 65 percent of costs coming from on-site labor, engineering, permitting and other soft costs. While residential hardware costs have fallen by over 16 percent in the past year, soft costs have actually risen on an industry-average basis by 7 percent, primarily due to rising customer acquisition costs among national and local players alike.
In the non-residential market, soft costs remain a challenge as well. Hardware costs fell 15 percent year-over-year, while soft costs saw a modest decrease of 6 percent. In Q4 2015, soft costs accounted for approximately 50 percent of total system pricing. These costs can be even higher for projects in areas with strict labor requirements and particularly high in jurisdictions with stringent permitting and interconnection requirements. In order to continue reducing costs, developers and EPCs are looking to squeeze additional power density for commercial sites and amortize fixed costs over more power output -- and therefore reduce dollar-per-watt and dollar-per-kilowatt-hour costs.
Utility fixed-tilt and utility tracking projects in Q4 2015 saw an average cost of $1.33 per watt and $1.54 per watt, respectively. While utility system pricing is more tightly clustered than residential and non-residential system prices, state-by-state variation is prevalent. The Southeast U.S. led in terms of the lowest system costs, and the region played a significant role in bringing national pricing downward for utility fixed-tilt systems in 2015. Throughout the country, utility EPCs and developers continue to optimize their logistics and supply chains, as well as leveraging more mature installation practices, which has translated into major reductions in non-hardware costs across the board. In 2015, soft costs decreased 37 percent and 23 percent in fixed-tilt and tracking project, respectively.
Even with prices falling significantly throughout 2015, there still are tremendous opportunities to realize further price reductions in 2016 and beyond.
***
GTM Research uses a bottom-up modeling methodology to track and report national average PV system pricing for the major market segments. Download the report's free executive summary here.


 41
41
 15
15
 9
9