
What if it were easy for consumers to know how much energy a home uses and how much that energy costs? It could unlock a whole new market that doesn’t exist today worth hundreds of billions of dollars.
According to an Elevate Energy study, Chicago homes that disclosed energy costs sold almost one-third faster (43 vs. 63 days) and had higher deal closing rates (63 percent vs. 53 percent).
Barry Haaser and Jeremy Roberts at the Green Button Alliance noted studies in Illinois and Washington, D.C. that revealed that simply disclosing energy costs raised average sale prices by $4,000, regardless of energy use. Transparency is the likely reason for this -- there is less uncertainty and friction in the transaction.
Putting a metric on energy use that is easily comparable between homes could begin to value efficient homes far more.
So, what metric is the best for doing this? Rather than a laundry list, we need to focus on one or two that could fit in a 50 x 75 pixel box on MLS. If Zillow/Trulia added it to their listings, that could be the essential first step.
I propose energy use intensity, or EUI as kBTU/square foot/year. The rest of this article will outline my reasoning.
Focusing down to one or two metrics forces us to think of them in multiple levels. The metric we should be looking for is top level, similar to combined city and highway mileage for a new car. That helps narrow the field of vehicles to consider. Once we narrow down, then we dig deeper into more metrics like city and highway mileage, horsepower, safety features, etc.
How this might actually work
In the home-buying process, this metric will be used at the stage right after prequalifying. For example, a buyer qualifies for a $200,000 loan. What that really means is her income allows her to spend $950/month at 4 percent for 30 years.
Enter an energy metric. The real cost to own this example home includes taxes ($200/month), insurance ($100/month), and utilities ($200/month). So what you’re really looking at is about $1450/month, including all costs. This ignores maintenance costs for now.
What if one of the homes being compared is net-zero after solar panels and a home performance upgrade? Now utilities are only $35/month for meter fees. That frees up $165/month out of the $1450.
That $165/month at 4 percent is $22,000 over 15 years, or $34,000 over 30 years. That means a house with those energy bills versus a comparable home is likely to be worth $20,000 to $35,000 more than its competitors. It could be worth more because a home like that is likely to have fewer maintenance issues, since efficient homes usually have lower air-leakage rates, and lower air leakage typically leads to fewer moisture problems.
That’s for the market to decide. Right now, the market can’t see energy costs, so it doesn’t value them.
If we knew how much operating costs were for five comparable homes, and one home had double the operating cost, that would be an easy way to potentially eliminate one home from the list. That’s what this metric needs to do.
Cost alone is problematic
The trouble with cost alone is that it’s very squishy. It’s not a useful metric over long periods. Costs go up and down. The same house may cost $200/month with lower energy costs, but 10 years ago when costs were higher, it could have been $300/month for the same usage. Different fuels experience different pricing ups and downs. Fuel costs aren’t directly comparable, either. An oil-heated home generally costs a good deal more to heat than a comparable natural-gas-heated one.
In my opinion, the top-level metric needs to be usage-based. Cost is a secondary metric (although a close second).
Benefits of an effective energy-use metric
-
Home-buying comparisons: A useful metric to compare homes, even of different sizes
-
Home values: Efficient homes will be valued more, less efficient homes will be devalued. It’s easy to see a spread of $5,000 to $15,000 coming from this.
-
Drive home performance contracting: If inefficient homes are worth less, it will open up capital to improve them. The home performance industry is poised to help.
-
Rank contractors: If contractors can make measurable and predictable reductions to energy use and operating costs, they can be ranked by these capabilities. Better contractors will be able to charge more because they will better be able to predict home value changes.
-
Reduce lender risk: If a lender knows a home is less expensive to operate, the odds of default will tend to be lower. Lower risk can lead to lower rates. There is some data to back this up. (I nearly lost my first home after utility costs skyrocketed, so this one is personal for me.)
-
Reduce project financing costs for home performance projects: If realization rates get better from HP projects, banks can better predict value changes. The lower the spread in realization rates, the lower the risk of the project. Interest rates should follow. PACE rates routinely run in the high single digits; we find that interest rates this high will eat up all of the energy savings. Rates nearing prime would really help make more projects happen. Rates wouldn’t be lower out of altruism; the market would show there is lower risk.
If those are the benefits, there are a number of things this top-level metric needs to be able to do well.
Elements of a strong "top-level" energy metric
-
One or two: The metric needs to fit on MLS listings, likely 50 x 75 pixels.
-
Free: No professional needs to be paid to obtain them.
-
Actual energy use: No proxies, no ratings.
-
Difficult to game: Simplicity is key.
-
Bankable: In time, the metric would be considered by banks for mortgage qualification.
-
Layman friendly: Quickly explainable and understandable.
-
Raw: A raw number with no math required or transparency to backtrack to raw numbers.
-
Granular: Wide range of values, i.e. 94.2 percent vs. a 1-10 scale.
-
Adjustable: Adjusts automatically over time, since the housing stock won’t stay the same. The Home Energy Rating System (HERS) is locked on the 2006 International Energy Conservation Code, which limits its usefulness as a comparison -- 90 may be good today, but what about in 20 years?
-
Comparable: Easy to compare homes of different sizes and using various fuels.
How does energy use intensity stack up?
EUI has all of these except the raw part. I feel it’s worth the sacrifice for that one item, particularly because with only three numbers behind it -- electric usage, heating fuel usage, and square footage -- it’s easy to figure out if any funny business is going on. Plus, it has a unique benefit.
A scale of 0-100
In kBTU/square foot/year, the scale for EUI generally falls in a range between zero and 100. This is very similar to a HERS score, and like a HERS score, zero is net zero. A 0 EUI means either no energy usage or completely offset energy usage. EUI 100 is a bit piggish, but not awful. Explaining what 6.4 million BTUs per year means to a homeowner sounds like work. Explaining 0-100 sounds very simple.
Here is a chart of Energy Smart Home Performance’s projects using EUI using the ResiSpeak tool.
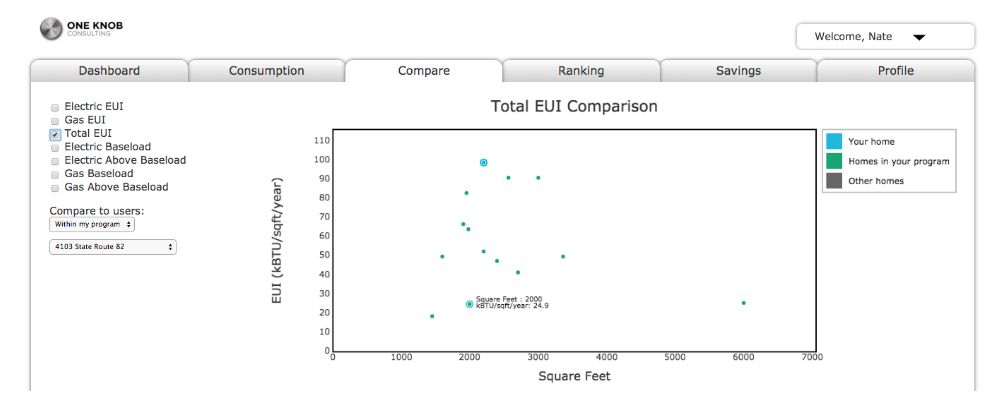
The highlighted home with a 24.9 EUI is an all-electric deep energy retrofit for Hiram College called the TREE House. Is it possible that home might be worth more than the home at 100? (Ironically, that is my house.)
Already common
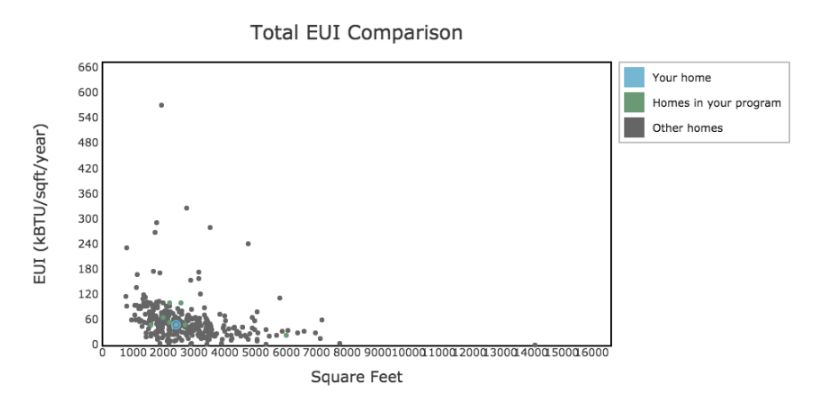
Passive houses aim at 4.75 kBTU/sf/yr for heating and cooling (the company 475 Supply takes its name from that value). The Department of Energy has the Building Performance Database, which uses EUI and has data on thousands of homes across the U.S. It’s not something new we have to come up with. In fact, here's a chart showing my projects overlaid on the Building Performance Database homes in Ohio.
Difficult to game
EUI only requires the inputs of fuel usage and square footage. Fuel usage usually comes from utility bills, so those are tough to game. We’re down to gaming square footage. I propose we use county record square footages. County records have these attributes:
- Publicly available: Zillow, Trulia, etc. pull from them.
- Difficult to game: They are what they are. Homeowners can’t simply make up a number and put it in a calculator, although it would be good to give them such a calculator for what-if scenarios like those that Zillow provides.
- Possible to change: Homeowners can petition to have things changed. They have a disincentive to overstate square footage (which will reduce EUI) because they will pay higher taxes. Less gaming is likely to ensue.
- Consistently inconsistent: While frequently incorrect, they are likely to be fairly consistently so. Plus, they can be changed.
Conclusion
My argument is for two primary energy metrics: energy use intensity (EUI in kBTU/square foot/year) and total annual energy cost. These are only "top-level" metrics. The raw data needs to be available so that deeper analysis can be performed when narrowing to a few home choices.
These metrics can create total transparency around ownership costs of homes and influence home values, opening up a new market for home performance upgrades and lowering risks for lenders. Lower risks mean lower interest rates, which mean more projects make economic sense: in other words, a virtuous cycle.
This virtuous cycle can lead to numerous societal benefits: jobs that can’t be exported, reduced pollution, reduced health consequences from that pollution, and an easier transition off of fossil fuels because more homes will be capable of going all-electric. (We have four pre-1920 all-electric homes under our belts now -- one is getting solar panels this month.) There are many more benefits that could be argued for as well.
All because we started publishing a few numbers. Is this assessment overly optimistic? Of course, but it’s probably not that far off. Chant with me: EUI! EUI!
It’s not that hard to make it a reality. If Zillow and Trulia add it, or the National Association of Realtors pushes for it, it could happen very quickly. The Green Button program can be used with monthly data, making data access for easier. This really isn’t that hard of a lift.
Nate Adams is the founder of Energy Smart Home Performance. This piece was originally published at his blog and was reprinted with permission.


 41
41
 15
15
 9
9