
As odd as it may sound, this is an exciting time to be in the solar industry. It is an industry poised for massive growth.
Unfortunately, the doom and gloom surrounding events like Solyndra and other failures is masking an epic positive change in the energy industry. The very cost and price reductions that are causing all the angst are also driving up demand. As we reach grid parity in an ever-increasing segment of the global market, we are witnessing the true, economically driven birth of a global solar industry.
As we enter this brave new world of what I refer to as Solar 2.0, there are significant opportunities where the U.S. has real competitive advantages and can succeed. This article will focus on the first part of what I hope will become an ongoing dialog on the topic of a U.S. roadmap for success in solar. In this first part, I will suggest that we have passed the tipping point and solar is becoming the renewable energy of choice globally.
First, let’s look at the current situation. Much of the current negativity is due to the impact of massive overcapacity on the market, but this overcapacity is actually a normal part of growing pains. Sure, these growing pains are particularly agonizing, but they are not unprecedented. For many who were involved in the semiconductor industry, you've seen this cycle before -- in fact, many times. Shown below is one representation of the semiconductor memory business cycle.
I have personally witnessed at least five of these cycles.
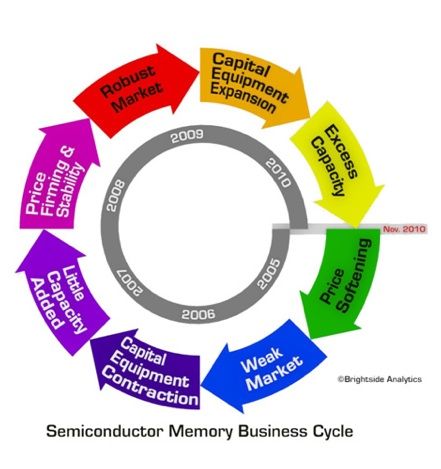
Graphic from Brightside Analytics
The cycle can start whenever there is over-enthusiasm for a market ("Robust Market"). The over-enthusiasm can exist for many reasons, but my observation is that it is particularly pronounced when a technology or business area is deemed strategic by industry, by governments or both. The strategic nature drives capacity additions ("Capital Equipment Expansion") over and above what might be seen as economically necessary. As new entrants come in and existing companies expand in order to maintain or increase market share, excess capacity is inevitable ("Excess Capacity"). This over-capacity drives prices down ("Price Softening") as companies try to reduce inventory. Companies cannot maintain profitability, and cash flow problems slow down or halt the expansion ("Weak Market"). Manufacturers stop buying equipment and some even go out of business ("Capital Equipment Contraction"). As a result, the supply slows down, stops, or even reverses as capacity comes off-line ("Little Capacity Added").
Now, in parallel with these dynamics on the supply side, the “Price Softening” three steps back also has an impact on demand. As with any commodity market, lower prices increase demand. This is certainly true in the energy industry. As demand increases with supply softening, we begin to see prices firm up ("Price Firming and Stability"). As manufacturers see prices stabilizing, profits come back and the market looks good again. The greed overcomes the fear and companies once again look at capacity expansion in order to gain market share. Thus, the cycle starts over.
It appears to me that the current panic in solar might be amplified somewhat because this is our first real cycle, and people who haven’t experienced this before feel like the sky is falling. As an industry, we do not yet understand that these are just normal growing pains. We could, of course, learn from the past and not repeat these painful cycles, but that is unlikely. Solar is a strategic industry, and large multinational corporations as well as entire governments get into the mix with policies and incentives that drive what seems like irrational behavior. This is still happening in China, so we are not through the bottom of the cycle yet. Some capacity is coming offline and prices have firmed a little, but there is still significant excess capacity, so we have another year or so before we get back to “Robust Market.” The demand is there, but there is not yet enough, and the profitability needed to enter the next capacity expansion cycle doesn’t yet exist.
Do not despair. It is this cycle, with its consistent and relentless price decline pressure, that is now driving the real birth of the solar industry.
Let’s look more closely at cost, as it is cost (and resulting prices) that drives industry growth. Let’s look at the concepts of learning curve and tipping point and how each of those relates to costs and how that drives the solar industry.
The chart below shows the solar price reduction over time in the traditional “learning curve” format. In this chart, module ASPs (average selling prices) came down from ~$26/watt in 1980 to ~ $2.60/watt in 2009. This is an amazing 10X reduction in about 30 years. Breaking it down to smaller increments, it's a 16.6 percent reduction for each 2X increase in cumulative volume.
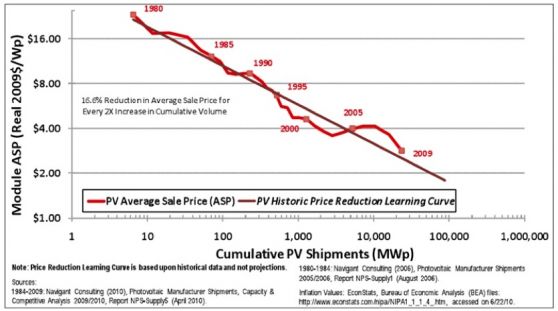
Chart data from Navigant
But this is only the beginning of the story. You can see in the chart the “hump” from 2005 to 2009. This was a one-time industry situation based on polysilicon pricing. This transient increase in poly pricing is a story unto itself, but suffice it to say it was only a temporary diversion from the cost reduction trend. Once the poly shortage was rectified, panel costs resumed their downward plunge, only this time, things were different.
The difference was China. China had been dabbling in solar for a while, but by 2005 it was having a huge impact. Much has been written on this, so no need to belabor it here, but China decided that solar was a strategic resource and embarked on an ambitious program pushing production capacity at several levels in the food chain. Even with significant overcapacity in place in 2009, Chinese PV companies continued to add capacity in 2010 and 2011. The resultant excess capacity has driven prices below costs as suppliers try to clear out inventory to generate enough cash to keep afloat. The crazy price decline of Tier 1 module suppliers that started a few years ago is shown below. Of course, the decline didn’t stop, but rather continued in 2010, 2011, and 2012. Module prices may have stabilized somewhat recently, but are well below $0.70 per watt even for top-tier suppliers.
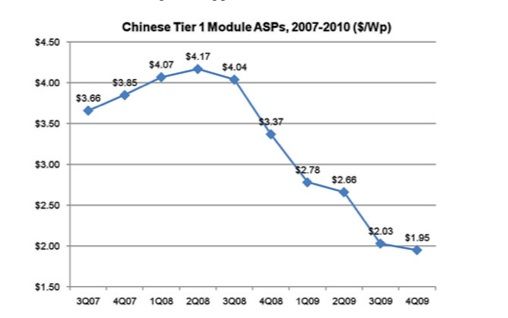
GTM Research
Because solar is a commodity, as China (the lowest cost producer) goes, so goes the world. Over the last four years, the price of solar panels has dropped an amazing 85 percent. Panels are now not one-half, not one-quarter, but almost one-eighth the price of four years ago. We essentially fell off the learning curve. This abrupt change in the curve was pointed out recently quite nicely by Dick Swanson, founder of SunPower. There are many ramifications to this once-in-an-industry-lifecycle occurrence, including the industry tipping point, resultant growth rate, competitive shifts, industry consolidation, vertical integration, economic and trade policy, viable future success scenarios, and maybe even the competitiveness of the U.S. economy as a whole. All of these topics are important and interesting, but the balance of this article will focus primarily on the tipping point and its impact on growth.
There is a fine book by Malcolm Gladwell, The Tipping Point: How Little Things Can Make a Big Difference, that provides an in-depth examination of the concept of the tipping point. We can only get into a somewhat limited analysis in this forum, but the short story is that it is my belief that we have passed the tipping point in solar.
It is not so much that solar is already economically competitive with traditional sources of energy, although it is in many cases. It is more that the momentum has shifted so far and so fast, that it is unlikely that any other renewable energy source will be able to catch up. To put a sharper focus on the issues, just look at the possible scenarios for 30 to 50 years from now:
- There is little chance we can continue to use fossil fuel to satisfy our growing energy needs.
- Hydro is great, but will be limited by geography.
- Wind is great, but blows at night when we don’t need it, and grid storage is really tough.
- Nuclear is, well, even if it makes sense no one wants it in their back yard. You can’t site it.
- Solar is clean, abundant, works at any scale, is easily distributed, and now it is cheap.
I’m sure the quick summary above does not do justice to the world of renewable energy, but from the 30,000 ft. level, it looks like solar is really ready to take off.
It is the price of solar and its comparison to the existing cost of electricity that drives industry growth. This is the concept of grid parity, where the cost of solar electricity = cost of grid electricity.
The charts below summarize a study done by NREL to determine when and where we hit grid parity in the United States. It should be noted that this chart is using the retail price of electricity -- that is, the prices that you or I pay at the meter at our home or the price businesses pay at their factories. This retail price, of course, is much higher than the cost to generate electricity. For example, in Monte Sereno, California, I pay $0.28 per kilowatt-hour for electricity. This electricity probably only costs $0.08 to 0.10 per kilowatt-hour to generate. Of course, the electricity generators are typically many miles from my home, so there is also the cost of transmission and distribution. And of course, PG&E has to make a profit.
Some would say we have not reached grid parity until we hit the wholesale, not the retail, cost of electricity. I disagree. It just depends on who the customer is. As a paying customer for grid electricity (from PG&E), I can tell you that we are at grid parity at my house. I am a believer that the future of U.S. energy independence will come through more distributed (i.e., solar on rooftops) generation. That battle between distributed and centralized generation is yet another important topic that we don’t have time to cover here.
So, with the caveat that we are talking about retail costs, we can look at the NREL data. The figure on the left shows the status of the United States in 2008. The dark red areas are where we are already at retail grid parity. You can see it is a fairly small portion of the map on the left. But, this level of grid parity is based on an installed cost of solar of about $8.00 per watt, or roughly the cost in 2008.
The chart on the right shows the anticipated areas of grid parity if the install price of solar is lowered to $3.50 per watt. This is an amazing increase in coverage. So, when will we get to $3.50 per watt? The answer is we are already there in some states and will soon be in many others.
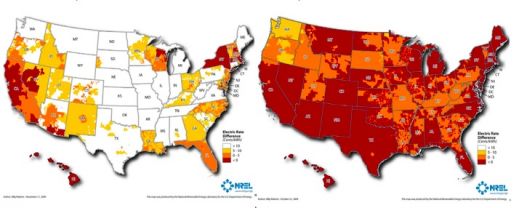
Source: NREL
Let’s try to translate that into demand in terms of gigawatts. Some great work has been done by Richard Keiser at Keiser Analytics. He went through each state, country and even area code in the U.S. to determine cost and demand for electricity at each price point. There are, of course, some simplifying assumptions that need to be made to translate installed cost into the levelized cost of electricity (LCOE), but without getting into complicated LCOE discussions, it seems that reasonable assumptions have been made. Figures are given with and without the government ITC subsidy (Investment Tax Credit). Here are the estimates made of demand at each level of installed cost:
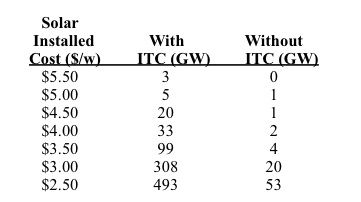
As you can see, at the $3.50 per watt install cost, where much of the map above goes red, there is almost 100 gigawatts of demand in the U.S. To put that in perspective, the U.S had a record-breaking year in 2012 for solar installations with 3.2 gigawatts installed. Obviously, we have just scratched the surface. Of course this depends on maintaining the Investment Tax Credit. But even with no government subsidy at all, we just need to get to $2.50 per watt installed cost to see more than 50 gigawatts in demand.
Now, just to clarify what is possible, let’s look at Germany. In Germany in 2011, the average installed cost was only $2.25 per watt. The country passed $3.50 per watt a long time ago. It is true that Germany has about ten times more solar installed than the U.S. and is therefore further down the learning curve, but can we be that much farther behind? We have access to the same panels, inverters, and all other components needed to install a system, so we should have the same materials costs. Germany’s labor rates are actually higher than in the U.S., so we should have equal or lower labor costs. So, what is the difference? Why aren’t we below $2.50 per watt already?
To be honest, when it comes to solar, Germany actually has a cooperative government and a more intelligent, rational energy policy than the U.S. And I am not just talking about the feed-in tariff (FIT) that stimulates demand, although that is relevant. The FIT affects demand, not costs. I am talking about the streamlining of the bureaucracy that allows solar permitting to be done in days or hours, as opposed to weeks or months. The difference in these “soft costs” between Germany and the United States is ridiculous, and it accounts for almost all of the inflation of our installed cost.
Call me crazy for believing in our government, but I truly believe we will fix this paperwork problem. You have to hand it to Steven Chu, our Secretary of Energy. He is a Nobel-Prize-winning, world-class scientist, and even he saw that the soft costs are a killer. Through the DOE, an agency more known for exciting technical programs, he instituted a program to reduce soft costs. Bravo, Steve!
We have yet to see the benefits of these soft-cost reductions, but the following data from GTM Research supports that we are definitely tracking toward Germany’s costs. While the average residential cost in the U.S. is still shockingly high (almost twice that of Germany), this data shows it is dropping fast, about 5 percent to 10 percent per quarter recently. This translates into about a 30 percent yearly reduction. That would achieve the $3.50 price on the NREL chart sometime next year. I expect we might see it even sooner.
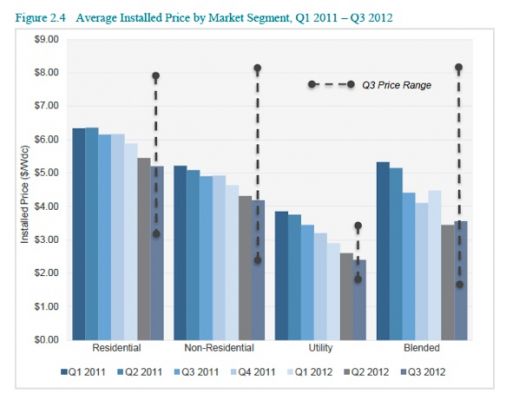
GTM Research
The success of the SolarCity IPO is highlighting this “downstream” part of the solar value chain, and we are seeing billions of dollars going into the installation, or “solar power plant,” side of the business. Look no further than Warren Buffett, considered by many the wisest investor of our time. He has just invested $5 billion in solar power plants. With this much money coming into the downstream part of the business, it is inevitable that competition increases just like it did in the upstream (panel) segment years ago. There are few barriers to entry in the installation business, so with little differentiation, there will be an intense focus to drive the costs out of every part of the installation process, including soft costs.
So, with a combination of focus from the DOE, Warren Buffet, and IPOs like Solar City, the soft costs will come down. The U.S. should not only get to the $3.50 per watt installation cost and therefore “create” the red map on the right soon, but we should be able to catch up with Germany and get to $2.50 per watt, which would drive over 50 gigawatts of demand even with no government incentives.
Pulling this all together, when reviewing the solar industry, sure, we see tremendous overcapacity and corporate failures left and right. If we look at this with some perspective, though, we see that the current events are part of a cycle. The same overcapacity that creates a sense of “doom and gloom” or makes us feel that the “sky is falling” is also driving down prices at an historic rate. In fact, the drop is so fast that it looks like we are falling off of the learning curve. It's true that there is still some cost reduction to be done in the downstream part of the business, but that is happening now. Overall, there is a strong feeling of momentum. There is so much money, people, supportive data, policy, and even entire countries behind solar that I feel it has become a fait accompli. We have passed the tipping point and we are witnessing the true birth of the solar industry. These are very exciting times.
In the coming months, I hope to engage in a dialog with those who might share some of this optimism to discuss a roadmap for that success, and how the U.S. has real competitive advantages and can, must and will succeed in this brave new world of Solar 2.0.
***
Brad Mattson will be speaking in more detail on the dawn of Solar 2.0 at a free event in Palo Alto, California on the evening of February 13. For more details, visit the Silicon Valley IEEE Photovoltaic Chapter website.
Currently CEO of Solexant, a next-generation solar startup, Brad Mattson is a renowned entrepreneur from the semiconductor industry. Starting at Applied Materials, he later founded and scaled both Novellus and Mattson Technology, and to date is the only founder of two publicly traded semiconductor equipment firms. Most recently, Mr. Mattson was a Partner at Vantage Point Venture Partners working in the cleantech area, leading the solar sector, but also focusing on lighting, transport and scaling. Mr. Mattson holds twelve patents in semiconductor technology, and in 2005 he was listed as one of the top 50 most influential people in the semiconductor industry. He has received the Entrepreneur of the Year Award in 1998 from Ernst & Young, the Distinguished Alumni Award from San Jose State University in 1999, and the Founders Award for Innovation and Entrepreneurship from Santa Clara University in 2008. Mr. Mattson not only brings the management experience of taking startup companies to scale and IPO, but also adds world-class equipment expertise to the world-class materials expertise of the founders.


 41
41
 15
15
 9
9