The U.S. energy storage market is in a period of transition.
Last year was a big one for storage, with Q4 2015 alone logging more total megawatts deployed than 2013 and 2014 combined. This growth drew increased attention from investors, regulators, consumers, and system operators. And in 2016, battery storage has expanded its foothold beyond its historically favorable markets, capitalizing on improved economics and a renewed focus on reliability. GTM Research has analyzed several key indicators of a transition for America's storage market.
Front-of-the-meter deployment trends
The front-of-the-meter energy storage market logged another strong quarter in Q2 2016, recording 32 megawatts of new installations. This new capacity is down 10 percent from Q2 2015, but up over threefold from Q1 2016, continuing the trend from 2015 of deployments increasing toward the end of the calendar year.
Grid-scale energy storage is getting traction outside of its historically strong markets. New deployments in PJM are down in 2016 following the institution of an interim cap on RegD resources the frequency regulation market. For the first time since Q2 2014, PJM did not represent the majority of utility-scale deployments.
Front-of-the-meter policy trends
Policy developments dominated news in the front-of-the-meter market. Energy storage procurements in response to the Aliso Canyon gas leak in California could serve as a case study for energy storage as an expedited solution to capacity issues. SDG&E has signed an agreement with AES to install and commission 37.5 megawatts of Samsung batteries by January 2017. SCE has announced two 20-megawatt projects, one to be built by AltaGas with Greensmith batteries and one using Tesla batteries, along with a 2-megawatt project by Powin Energy and a 5-megawatt project from Western Grid. Successful deployment in the short timeframe required would be a tremendous success story for grid-scale batteries, and serve as further proof of the technology’s speed of installation and potential to enhance reliability.
Outside of California, legislation was passed in Massachusetts that could lead to an energy storage mandate, and legislation proposing a federal investment tax credit for energy storage moved forward in the U.S. House of Representatives. However, prospects for further developments during an election year are slim. Energy storage is attracting interest in increasingly diverse markets, including MISO, where the first battery storage system in the ISO's territory -- a 20-megawatt, 8-megawatt-hour deployment providing frequency regulation and reliability services -- was brought on-line in May.
Energy storage has encountered setbacks in other regions. For example, ERCOT halted the activities of the Future Ancillary Services Team, leaving stakeholders there to work toward incremental changes in storage market participation rather than a complete overhaul.
Market participants continue to look for clarification on energy storage eligibility, with only PJM and CAISO defining resource types that explicitly allow energy storage to participate fully in the market. FERC’s inquiry into energy storage in whole energy markets (AD-16-20) requested an inventory of energy storage participation across all ISO/RTO markets, which could signal that FERC is looking to facilitate energy storage as a resource in energy, ancillary services and capacity markets through rule and tariff changes.
Front-of-the-meter outlook
GTM Research projects the front-of-the-meter market will grow substantially over the next five years, from 192 megawatts deployed in 2015 to more than 1,000 megawatts in 2021. This fivefold increase in megawatts from 2015 to 2021 will correspond to a more than 34x increase in megawatt-hours installed annually, as deployments shift toward more energy applications in future years and expand beyond the short-term frequency regulation applications that dominate the market currently. The average discharge duration for all utility systems is projected to be 3.25 hours by 2021, up significantly from 30 minutes in 2015.
FIGURE 1: U.S. Annual Energy Storage Deployment Forecast, 2012-2021E (MW)
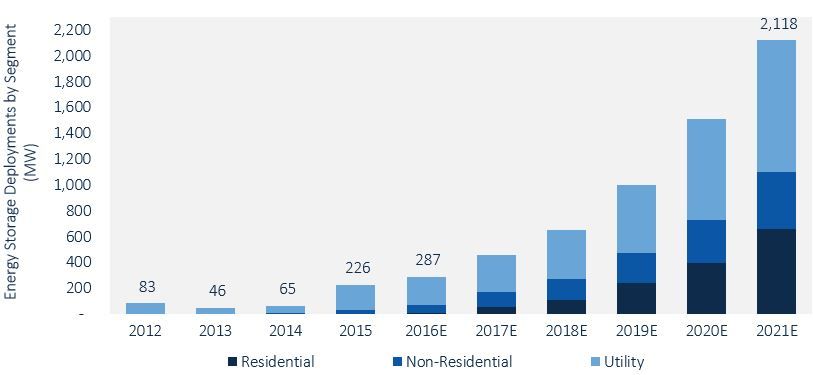
Source: GTM Research/ESA U.S. Energy Storage Monitor Q3 2016
Behind-the-meter deployment trends
Though front-of-the-meter deployments continued to dominate the U.S. energy storage market in Q2 2016, behind-the-meter energy storage deployments were up 66 percent year-over-year. Both the residential segment and non-residential segment saw slight quarter-over-quarter growth, driven by a few key trends.
Energy storage economics continue to improve, as increased manufacturing volumes and technology innovations drive down system prices. Reductions in battery costs and balance-of-system costs, coupled with improvements in systems integration, have worked together to improve system economics.
FIGURE 2: Q2 2016 Behind-the-Meter U.S. Energy Storage Deployments (MW), 2013-2016
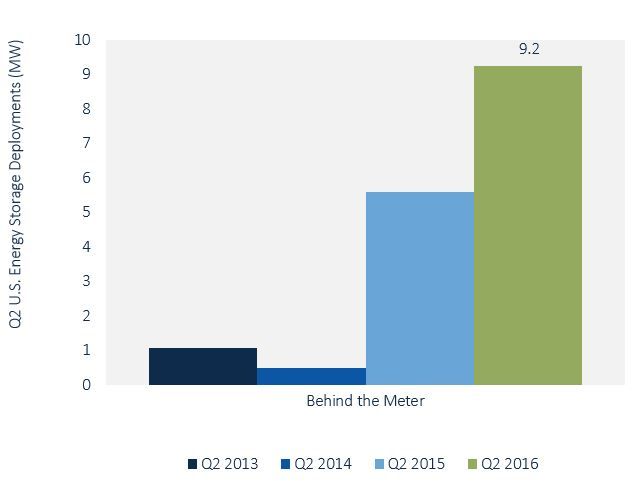
Source: GTM Research/ESA U.S. Energy Storage Monitor Q3 2016
Behind-the-meter policy trends
Rate-structure reforms offer a further driver for residential storage. Utilities are increasingly investigating and proposing rate structures that include time-of-use rates and residential demand charges, which, if implemented, may create additional opportunities for behind-the-meter storage via time-of-use shifting and residential demand-charge management, depending on the level at which these rates are set.
Within the past year, California, Hawaii and Nevada all passed policies to revise in-state net energy metering (NEM) policy. In general, NEM alterations reduce the compensation customers receive for exported solar electricity, and thus these changes encourage customers to pursue solar-plus-storage for self-consumption. As energy storage system costs continue to decline, solar-plus-storage will increasingly make sense, and in some cases it will compete directly with solar-only systems.
Notably, Hawaii instituted a new tariff structure in late 2015. Residential customers located in HECO territory wishing to install solar PV must go on either the grid-supply tariff, which allows for solar export at the wholesale rate, or the self-supply tariff, which encourages solar-plus-storage. The grid-supply tariffs place caps on the total megawatts of solar PV that can be installed; these caps have already been reached for Maui Electric and Hawaii Electric Light territories, and are over 95 percent subscribed for Hawaiian Electric territory. As these caps are reached, Hawaiian residential customers are expected to deploy more solar-plus-storage under the self-supply scheme.
California remains the largest behind-the-meter energy storage market in terms of cumulative megawatt capacity deployed since Q1 2013. However, in Q2 2016 emerging state markets saw increased deployments as developers and storage system vendors begin to explore other state markets. In fact, last week Tabuchi America announced a $300 million loan and lease program for solar-plus-storage in 17 states, the majority of which are considered emerging markets. Q2 2016 saw a continuing trend of emerging state markets experiencing greater energy storage deployments; though individually these markets are small, collectively they accounted for the majority of cumulative U.S. residential energy storage deployments since Q1 2013 and rank second in cumulative U.S. non-residential energy storage deployments since Q1 2013.
This expansion is also influenced by a slowdown in the California behind-the-meter energy storage market in the first half of 2016. California’s Self-Generation Incentive Program is a key mechanism for supporting the historical growth of the state’s behind-the-meter energy storage market; however, the SGIP experienced complications in early 2016 that led to funding delays, and this has influenced the slowdown in California’s behind-the-meter energy storage market, particularly in the non-residential segment. However, California’s behind-the-meter energy storage market is expected to ramp up again by the end of 2016.
Behind-the-meter outlook
The U.S. behind-the-meter energy storage market experienced substantial year-over-year growth, and this growth is expected to continue in the second half of 2016. Improving economics, NEM policy revisions and growth in emerging state markets will continue to drive customer-sited deployments. These trends converge to prime the U.S. behind-the-meter energy storage market to grow from 15 percent in 2015 to 52 percent of total annual megawatts installed in 2021.
***
For more information, download the U.S. Energy Storage Monitor executive summary here or email [email protected].


 41
41
 15
15
 9
9