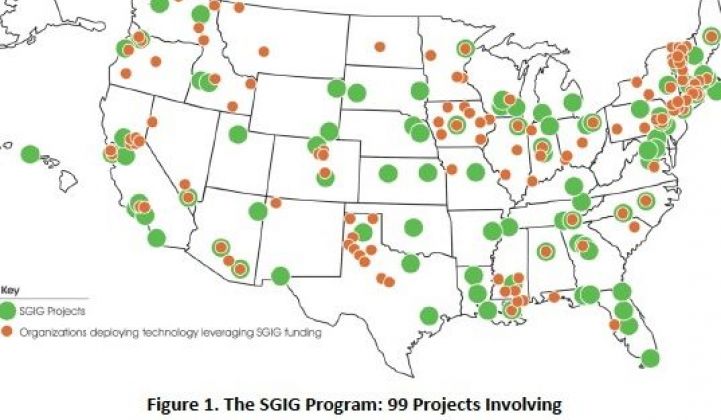
In October 2009, the Department of Energy named 99 projects as winners of a collective $3.4 billion in smart grid investment grants from the federal stimulus package. Combined with $4.5 billion in private-sector funding to match, the Smart Grid Investment Grant (SGIG) program represented a $7.9 billion, one-time boost for smart meters, distribution automation, transmission grid intelligence and customer connectivity technology.
Now, four years later, we’ve got a new update on how the majority of that money has been spent so far, and what it has accomplished, in the form of DOE’s SGIG Program progress report (PDF). Along with this update comes a reminder from DOE that $7.9 billion still represents “a relatively small down payment on the hundreds of billions of dollars the electric power industry will need to fully modernize the electric grid over the next several decades.”
Indeed, the Electric Power Research Institute (EPRI) has projected that U.S. utilities will need to invest roughly $17 billion to $24 billion per year to achieve a long-term payback of $1.3 trillion to $2 trillion in benefits by 2030. We’ve already seen reports from DOE on the economic impact of its stimulus grant-backed programs (PDF), as well as independent assessments of how these projects have been delivering economic benefits to utilities and their customers.
But with most of DOE’s SGIG programs still awaiting a final reckoning on how they’ve performed on meeting their myriad targets, we’ve still got a ways to go before the full picture becomes clear. Here’s a breakdown from DOE’s new SGIG update on spending across different technology categories, along with some key points on which categories of technologies have largely completed their work on schedule -- and which ones still have their work cut out for them.
As of the end of March, DOE had sent out more than $3 billion of its original cash commitments, with matching funds bringing the total spent to more than $6 billion. Those projects were spread across giant investor-owned utilities, small municipal and rural cooperative utilities, and a handful of non-utility companies.
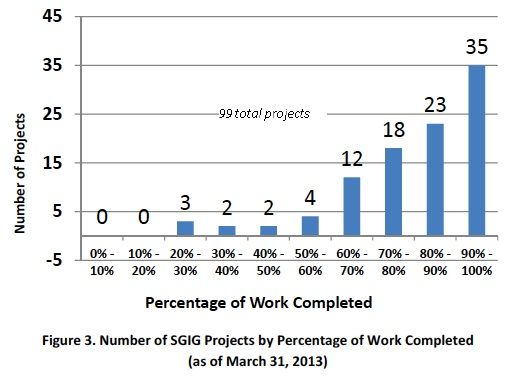
Of these projects, most are expected to complete equipment installations in 2013 and continue data analysis and reporting through 2015, DOE’s update states. “However, because of extenuating circumstances (e.g., weather-related delays), DOE has granted a one-year, no-cost extension to certain projects; these projects are expected to complete installations by 2014, with continued reporting through 2016.”
All told, 76 of the 99 projects have completed 70 percent or more of their SGIG project tasks, while a few are lagging pretty far behind, as this graph indicates.
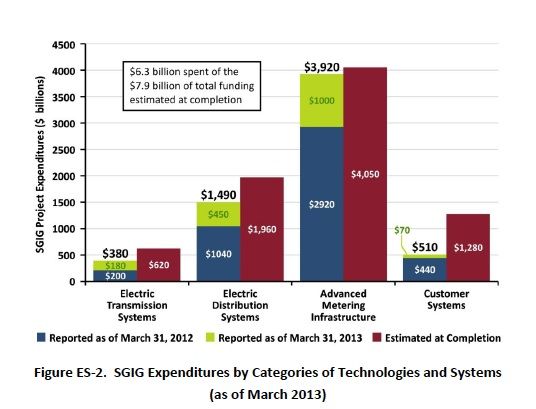
Breaking down completion rates by technology category, we see that smart meter deployments, which won the largest share of SGIG funds, have spent nearly all of their money. Distribution and transmission grid projects are close behind. But projects aimed at implementing customer-facing technology, “which depend on AMI installations and sometimes regulatory approvals, are lagging somewhat,” the report notes.
The fact that smart meter deployments are the furthest along of DOE’s stimulus grant-backed project will come as no surprise to an industry that’s watched the market boom, then sag, on the strength of that one-time jolt of cash. So far, the 65 advanced metering infrastructure projects backed by DOE’s SGIG program have installed 14.2 million smart meters, 92 percent of the 15.5 million planned by its completion date. That’s a significant share of the 46 million smart meters deployed nationwide as of last month, out of a target of some 65 million by 2015.
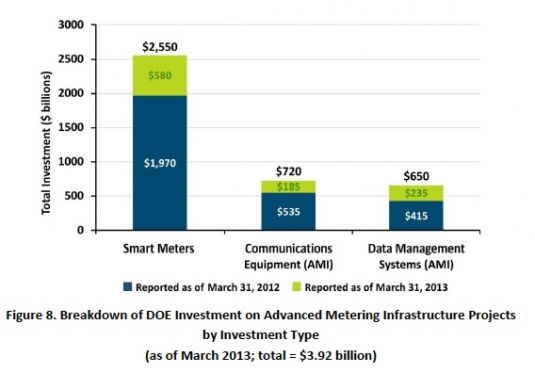
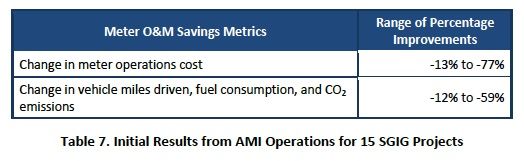
All told, $3.92 billion had been spent as of March on the meters, communications equipment, and data management systems to support these AMI rollouts. In return, utilities are projecting that they’re realizing savings in both metering operations costs and in reduced truck rolls to read meters, manage outages, connect and disconnect meters, and other functions that two-way communicating meter networks enable.
On the other side of the completion spectrum, customer system deployments are still pretty far behind in getting up and running. DOE’s new update cites several reasons for this, including “communications and systems integration issues to get smart meters and customer systems to work together effectively.”
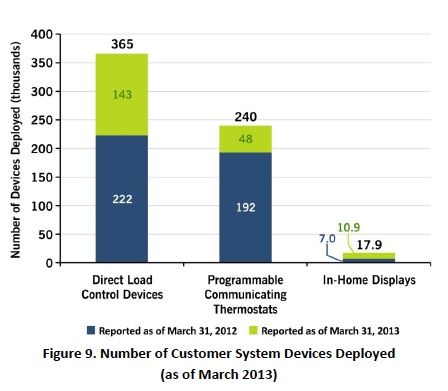
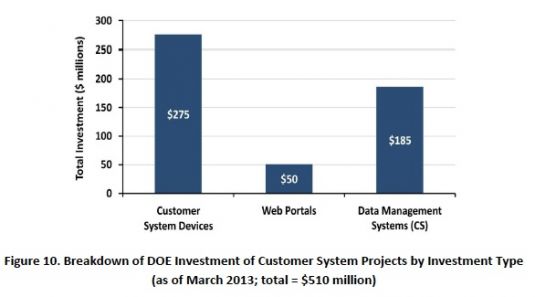
Beyond that, getting customers to sign up for participation in programs that offer them variable rates for power based on time of day or grid peak factors -- and getting regulators to approve such novel rate schemes -- has been a challenge. As of March, a total of $510 million had been spent on customer system deployments, most of it on devices, but with a significant portion for web portal and back-end data management system development.
In terms of what these customer-facing systems have accomplished, DOE has conducted eleven consumer behavior studies with nine of its grant participants to gauge the overall impacts of different methods to get customers to participate, different combinations of technology and a wide range of demand response and variable pricing plans. These can range from peak energy reductions of 30 percent or higher for some programs, to essentially no change in energy consumption behavior for others, as we’ve seen reported from other surveys that show just how tricky it is to create cost-effective customer programs via smart-grid-enabled technology.
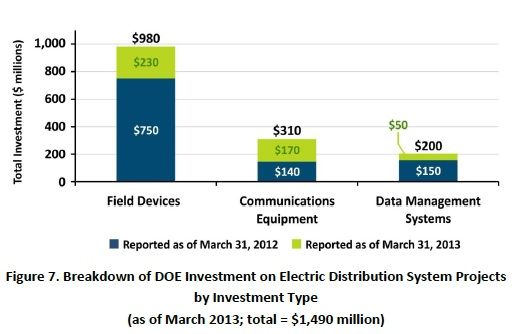
Distribution and transmission grid technology is far less unpredictable in terms of its cost-benefit calculations, but results still vary widely, according to DOE’s update. Take the 57 projects involving distribution grid systems, which had spent $1.49 billion in combined DOE and matching funds as of March, 76 percent of the $1.96 billion total.
These projects cover about 6,500 distribution circuits, or about 4 percent of the estimated 160,000 across the United States. So far, grant recipients have actually exceeded their initial goals of 7,500 automated switches, installing 7,661 such devices as of March with investment of $385 million. Automated capacitor installations weren’t so far ahead, with 11,100 of a planned 18,500 installed as of March, backed by $104 million of investment.
As for what those projects have delivered in improved reliability, DOE has calculated initial results from four projects covering 1,250 distribution feeders, based on standard industry measures of frequency and duration of power outages.
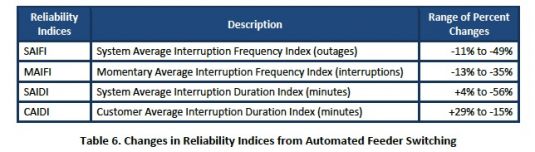
As you can see, while scores that measure how often outages occur dropped significantly, scores that measure duration of outages went up in some cases. In particular, CAIDI scores, which measure average length of outages per customer, went up sharply.
But as DOE’s report warns, that’s a problematic measure of reliability. The reason is that automated restoration systems like those implemented by Chattanooga municipal utility EPB and Chicago utility ComEd “generally reduce the number of customers experiencing sustained outages (reducing the denominator of the index), relative to the duration of the sustained outages (expressed in the numerator.)” In other words, fewer customers losing power can actually make CAIDI scores worse.
There’s a lot more data to be studied out of DOE’s update, including the performance of voltage and reactive power management (volt/VAR systems) on distribution grids, the rollout of synchrophasor systems across the country’s transmission grids, and other projects under its purview. Consider it a snapshot of a massive government program that’s still awaiting final word on its broad impacts on the nation’s electricity supply system.


 41
41
 15
15
 9
9