Windmills have been used to generate electricity since the 1880s, but only in the past decade has the U.S. wind industry really started to take off. Two recently released reports capture major trends in this flourishing sector, in the U.S. and globally.
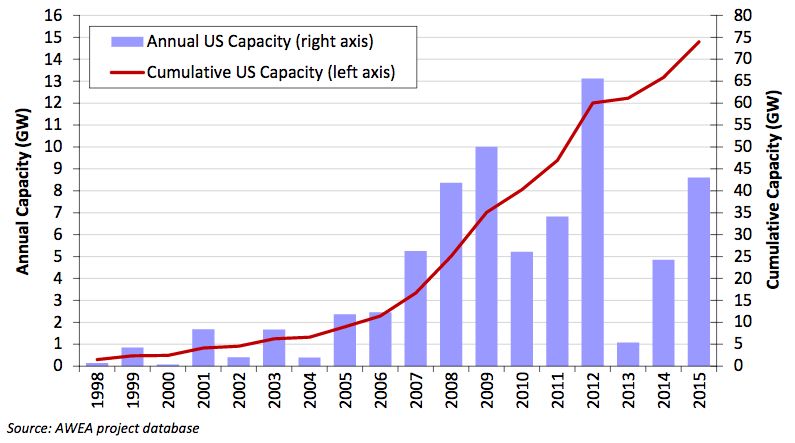
According to the annual Wind Technologies Market Report by the U.S. Department of Energy and Lawrence Berkeley National Laboratory (LBNL), wind power additions surged 12 percent in 2015 with 8,598 megawatts of new capacity, bringing total U.S. capacity to 73,992 megawatts. This growth mobilized $14.5 billion in investment last year, bringing total wind energy investment to more than $150 billion since the early 1980s.
Factors including recent improvements in the cost and performance of wind power technologies, corporate demand for wind power, and state renewable portfolio standards all played a role in driving the wind sector in 2015. Another key variable has been the wind production tax credit (PTC). In 2013, project development tanked when the PTC expired, but activity in the sector has since regained momentum thanks to policy renewals. Last December, Congress voted to extend the PTC for five years, which is expected to drive substantial additional capacity additions in the near term.
FIGURE 1: Annual and Cumulative Growth in U.S. Wind Power Capacity
Wind power isn’t only beating its own recent deployment figures, it’s also beating out other resources. In 2015, wind represented the largest source of U.S. electric-generating capacity additions at 41 percent market share, up from 24 percent the year before, and well ahead of solar and natural gas. Wind power represented 31 percent of all U.S. capacity additions over the last decade.
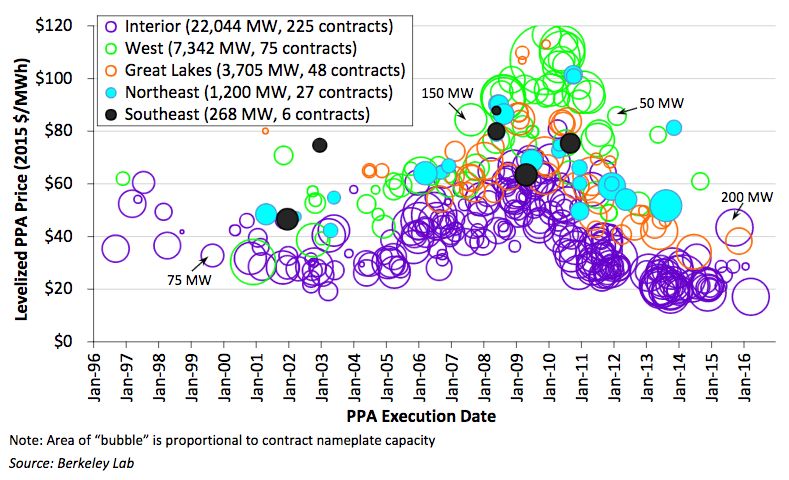
Cost reductions have been a major growth driver in the wind energy sector. Berkeley Labs found that average wind turbine prices have declined by 20 percent to 40 percent since 2008. Lower equipment prices have led to lower power-purchase agreement (PPA) prices, which factor in turbine prices, installed project costs, operations and maintenance, project financing and other considerations. In an analysis of 387 PPAs totaling 34,558 megawatts, the report found a clear downward trend in PPA prices since 2009 -- especially in the interior region, including Texas, which is home to the nation's best wind resources.
After reaching an average levelized price of $70 per megawatt-hour (7 cents per kilowatt-hour) for PPAs executed in 2009, prices in the sample dropped to an average of $20 per megawatt-hour (2 cents per kilowatt-hour) today. The authors note that the PPA prices expressed in the report mostly stem from the interior, the lowest-priced region, which may be skewing the results. The prices would also be at least $15 per megawatt-hour higher without incentives.
But that doesn't change the fact that wind power is now cheaper than natural gas and cheaper than coal in a growing number of places around the country. Locked-in long-term PPA prices also offer a hedge against rising and uncertain natural gas prices.
FIGURE 2: Levelized Wind PPA Prices by Execution Date and Region
Improvements in wind technology have helped to drive down costs. Turbine nameplate capacity, hub height and rotor diameter have all increased significantly in recent years -- all of which improve wind production and the ability to access untapped wind resources. A Department of Energy report released last year found that by deploying turbines with 110-meter hub heights, the land area with physical potential for wind deployment in the U.S. would increase 54 percent, and with 140-meter hub heights, the potential land area would increase 67 percent.
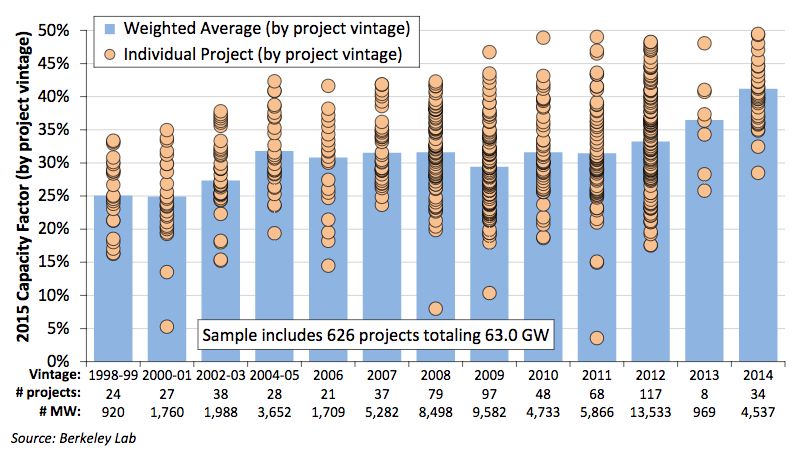
Better technology has led to higher wind capacity factors -- the ratio of actual power output over a period of time relative to a power plant’s nameplate capacity (basically, how well the resource performs in the real world). The LBNL report found that “the average 2015 capacity factor among projects built in 2014 reached 41.2 percent, compared to an average of 31.2 percent among projects built from 2004 to 2011 and just 25.8 percent among projects built from 1998 to 2003.”
FIGURE 3: Calendar Year 2015 Capacity Factors by Project Vintage
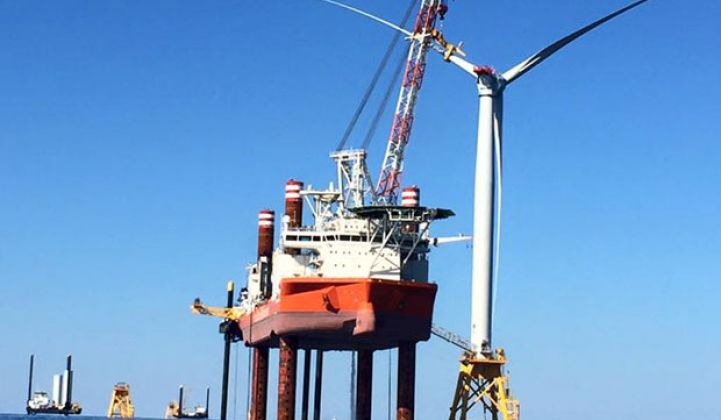
While onshore wind has been flourishing in the U.S., offshore wind has been lagging. But that’s starting to change. This week, construction of the 30-megawatt Block Island project off the coast of Rhode Island -- the first offshore wind project in the U.S. -- came to an end. The $290 million project is expected to supply power to 18,000 homes, replacing diesel as the island's primary energy source. According to the developer, Deepwater Wind, Block Island will start generating electricity by November.
High costs and tricky permitting processes continue to make offshore wind a challenge. Projects in Massachusetts, New Jersey, Virginia and Oregon have all experienced setbacks. But there are signs of progress. “Strides continued to be made in the federal arena in 2015, both through the U.S. Department of the Interior’s responsibilities in issuing offshore leases, and the U.S. Department of Energy’s funding for demonstration projects,” the LBNL report notes.
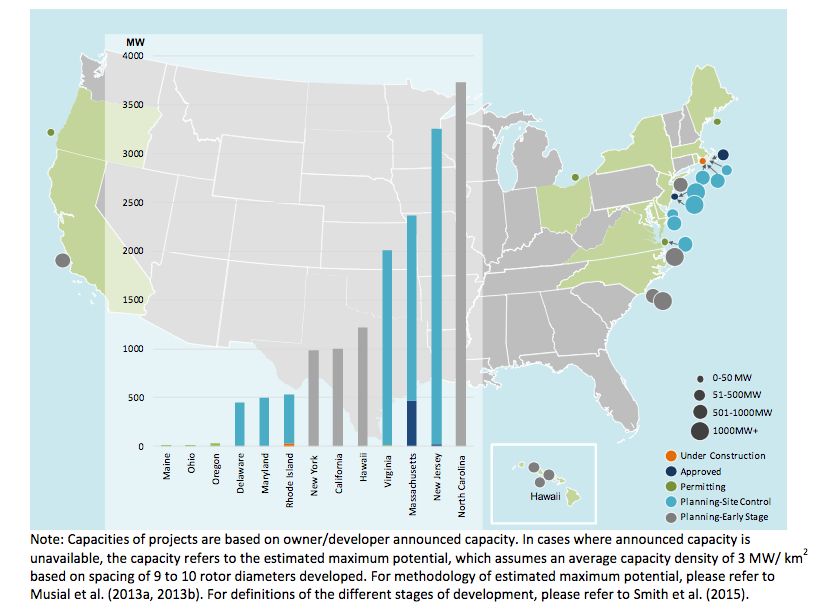
Today, there are a total of 23 offshore wind projects totaling more than 16 gigawatts in various stages of development in the U.S.
FIGURE 4: Offshore Wind Power Projects Under Development in the United States as of June 2016
Despite the difficulties, offshore wind has huge potential in the U.S. and around the globe.
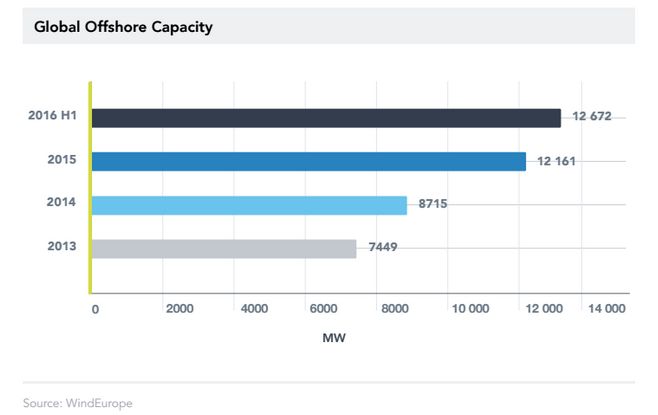
A separate report released last week by Planet OS, an energy-focused data infrastructure company, details major growth in the offshore wind sector. In 2015 alone, global capacity additions totaled almost 3.4 gigawatts, with Europe accounting for nearly 90 percent of that growth, the report states. In the first half of 2016, global grid-connected offshore wind capacity reached approximately 12.7 gigawatts, and another 5 gigawatts are expected to come on-line in the next 18 months.
“The offshore wind market is small today compared to other renewable energy technologies, but it is growing faster and is more efficient than all the other alternatives,” said Greg Kleiman, senior director of enterprise solutions at Planet OS. “Continued cost reduction can accelerate the growth rate, and being more data-driven is the key to make this happen."
Planet OS claims its earth science data access and intelligence can help wind companies increase their power output by up to 30 percent, while reducing operating costs. Its customers include RWE, Bravante and NASA.
The United Kingdom has the largest offshore wind market today, with about 40 percent of all installed capacity. Germany follows in second place with 27 percent, and Denmark is in third with 10.5 percent. China is the largest non-European market, with 8.4 percent of global market share. Offshore wind development in China is expected to accelerate in 2017, when the current low feed-in tariff expires and a new one takes effect.
FIGURE 5: Global Offshore Wind Power Capacity
The energy potential of offshore wind is immense. In Europe, the estimated untapped potential for further developments is 73 gigawatts. While more difficult to execute, offshore wind projects have distinct advantages over onshore developments. They can be sited close to population centers, and the projects can be larger and have superior capacity factors, because wind speeds are higher and more consistent over water.
According to the National Renewable Energy Laboratory, the U.S. has 4,200 gigawatts of developable offshore wind potential. “However, the path forward will be challenging as federal support for offshore wind might be hindered by a new administration,” the Planet OS report states.
In 2015, the U.S. ranked second in annual wind additions worldwide, both onshore and offshore, retaining its second-place rank in terms of cumulative wind capacity behind China’s stunning 145,053 megawatts. Though smaller in nameplate capacity, the U.S. actually led the globe in terms of wind power production last year.
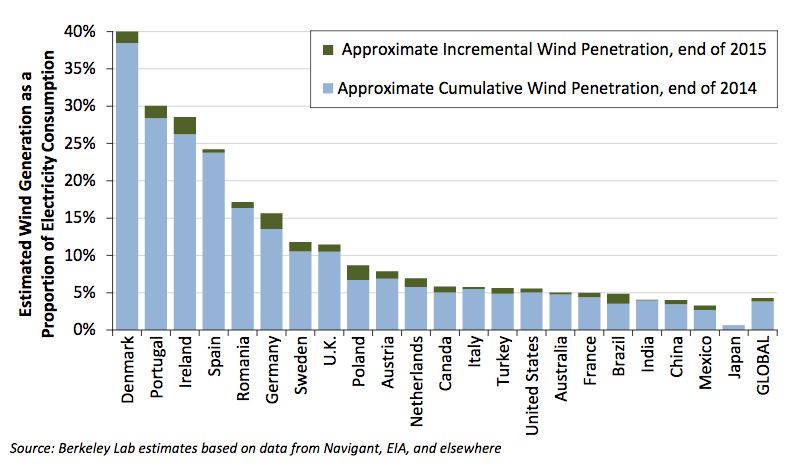
But the U.S. lags behind other countries in wind power as a portion of the overall electricity supply. Denmark has the highest level of penetration, with wind making up 40 percent of the nation’s electricity demand. In Portugal, Ireland and Spain, wind makes up 20 percent to 30 percent of electricity used. In the U.S., wind power provides an estimated 5.6 percent of electricity demand.
FIGURE 6: Approximate Wind Energy Penetration in Countries With the Greatest Installed Wind Power Capacity
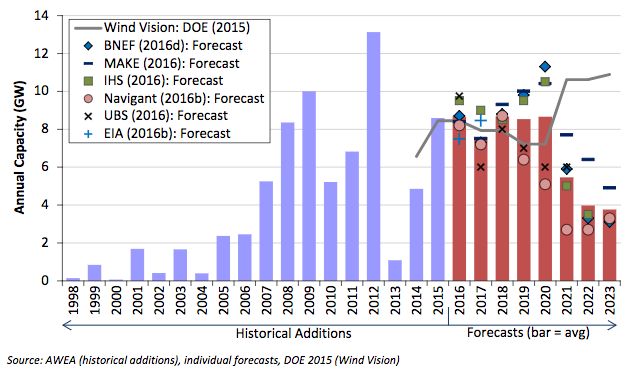
Going forward, the picture is mixed for the U.S. wind sector. The five-year extension of the PTC will allow the surge in wind deployments to continue through 2020. Near-term growth will also be driven by improvements in the cost and performance of wind power technologies.
Forecasts for 2021 and 2023 look a little different, however. LBNL’s analysis shows a downturn in new capacity additions as the PTC delivers less value. “Expectations for continued low natural-gas prices, modest electricity demand growth, and lower near-term renewable energy demand from state RPS policies also put a damper on growth expectations, as do inadequate transmission infrastructure and competition from solar energy in certain regions of the country,” the report states.
But the outlook could change. New technology innovations, changes in competing resource costs, new RPS requirements, growing corporate demand for wind energy and the EPA’s Clean Power Plan, if upheld, could create new wind markets and allow the surge in wind deployments to continue.
FIGURE 7: Wind Additions -- Historical Installations and Projected Growth
Listen to the Energy Gang's discussion on wind technology trends here.


 41
41
 15
15
 9
9